[Post 93]Learning investing/trading together part 18:How to read financial statements and financial ratio part 3
Continue on from the last post here...
3.Debt
Debt to equity
:max_bytes(150000):strip_icc()/debt_to_equity_-5bfd8742c9e77c0058b60440)
3.Debt
Debt to equity
- This is an important ratio and it will determine if you are evaluating a highly gear company. Companies with high borrowing are subjected to higher risk than companies with no or low debt. Investors would look at this ratio to determine the company's ability to repay its debt
- It measures the total liabilities to total shareholder equity. A higher ratio could mean the company is higher financed by debt
- Ideal Range: 2.0 or less
Debt to Net Profit

- Debt to Net Profit=Total Debt/Net Profit
- It measures the company's debt to its net profit
- Ideal range:3.0 or less
Debt to Cash Flow

- Debt to Cash Flow=Total Debt/Operating Cash Flow
- It measures the company's debt to its operating cash flow.It is an indication of the company's ability to cover its total debt with its annual operating cash flow
- Ideal range: 3.0 or less
Interest Cover
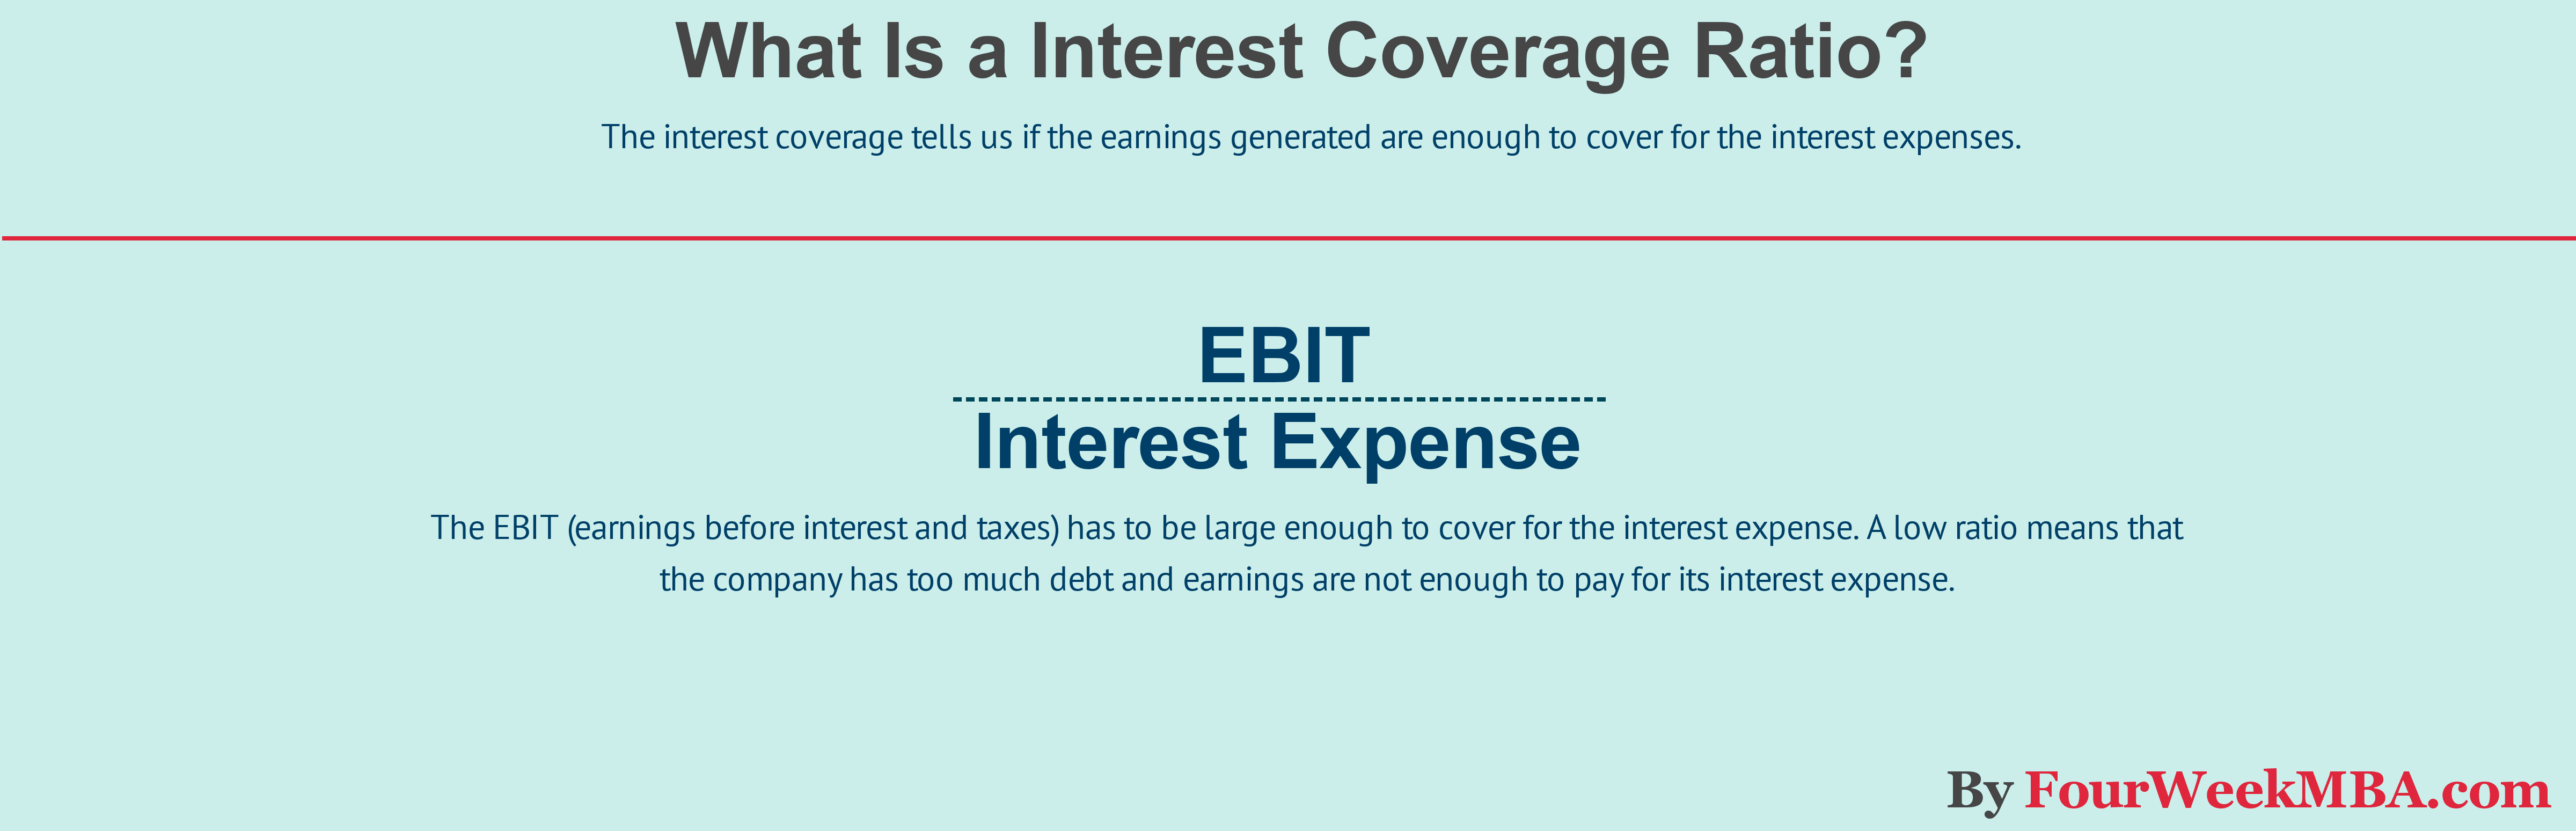
- It measures the company's ability to pay the interest expenses with sales
- Ideal Range:1.5 or more
Net Gearing

- Net Gearing =(Total Debt - Cash)/Shareholder Equity
- It measures the company's debt to its shareholder equity, The higher the ratio, the more debt and risk the company has
- Ideal Range:0.5 or less
Inventory Turnover

- Inventory Turnover= Inventory/(Costs of Good sold x 365 days)
- It measures how many days it takes to sell the inventory
- Ideal Range: The lower the number of days the better
Creditors

- It indicates how many days the company takes to pay its creditor
- Ideal Range: The higher number of days is ideal as the company can roll its cash flow but it also means that the company has cash flow problems and cannot pay off its debt
Debtors

- It indicates how many days it takes the company to collect its debt from its debtors
- Ideal Range: The lower the number of days the better
Others
Earning Per share
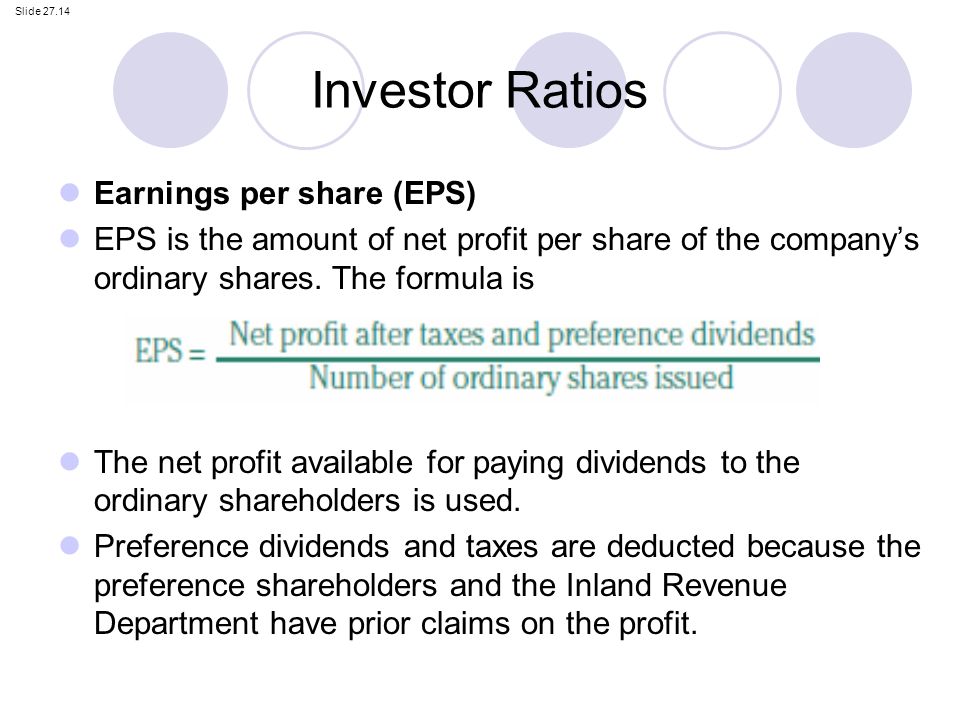

- It measures how profitable a company is on a shareholder basis. The higher the EPS,the more profitable the company is
- When earnings per share is negative, it means the company is losing money.
- Ideal range: Go for consistent and stable or growing EPS.
- It measures how much dividend the company is paying out compared to stock price.
- Ideal Range: Go for consistent dividends in the range of 5% to 8%
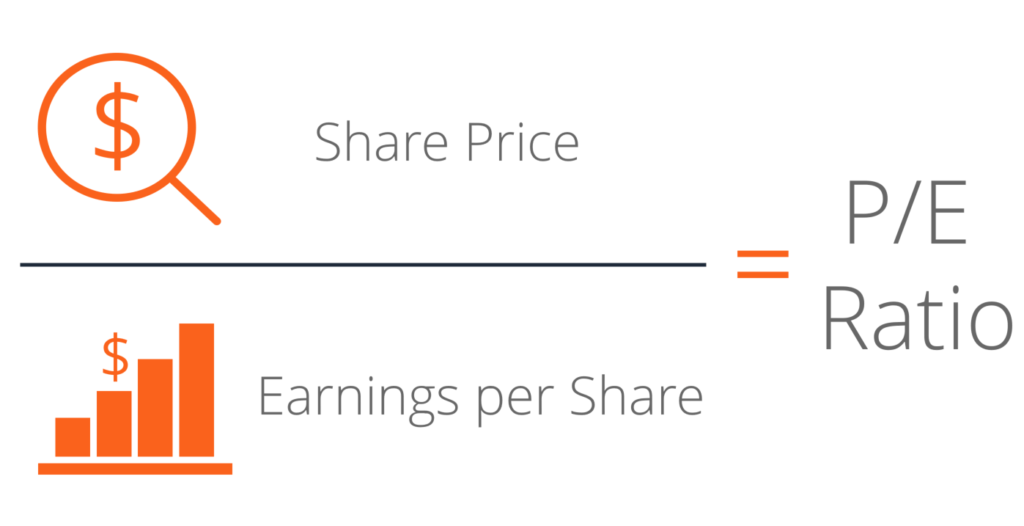
Price to Earnings(PE)
- It measures the share price relative to the company's earnings. A higher PE means investors are expecting better future earning or growth
- High PE=20 and above
- Average PE=11 to 20
- Low PE=1 to 10
- Average Market PE=15
- Ideal Range=It is better to buy a stock with lower PE ratio assuming all things being equal
- As the stock price goes up, the P/E ratio goes up
- As the stock price goes down, the P/E ratio goes down
- As a company’s earnings go up, the P/E ratio goes down
- As a company’s earnings go down, the The P/E ratio always equals the number of years it would take in earnings per share to equal the current price of the stock. So if the ratio is 20, it would take 20 years of current earnings to equal the current price of the stock.P/E ratio goes up
- Compare within the same industry
Price to Book(PB)


- It measures the company's market price to its book value. Book Value represents the total amount that would be left over after the company sell off its assets and repaid all of its liabilities
- Ideal Range: Low PB ratio may mean the company is undervalued. The PB ratio is used to evaluate the assets of each company such as property companies.
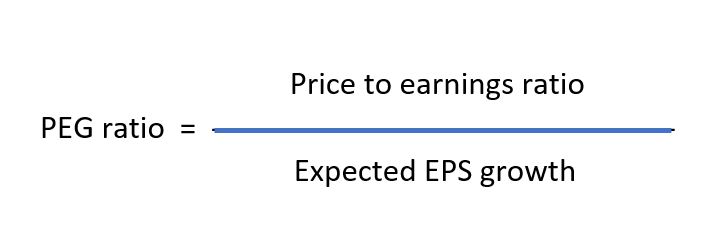
*Expected EPS growth is also known as Annual EPS growth
- It measures the company's value to the company future growth
- A lower PEG may mean the stock is undervalued
- Ideal Range:0.5 or less
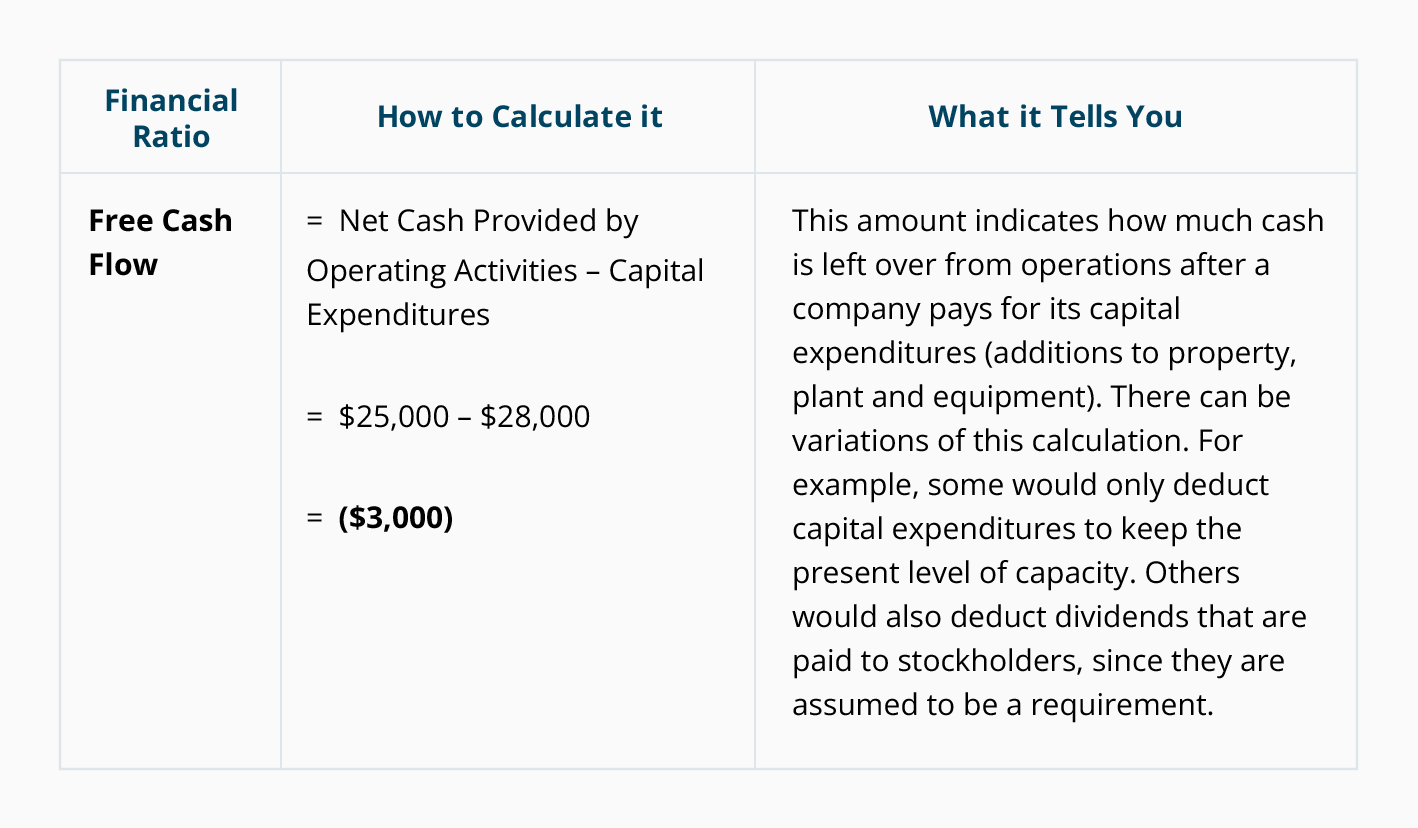
Free Cash Flow Ratio
Margin of Safety

While an investor can use financial ratios to evaluate how the business is performing over time, there are certain important points that investors must take note of:
1. Compare the financial ratio within the same industry. This is very important. For example, a different ratio is used to evaluate a food and beverage company compared to an asset-based company
2. Inflation can badly affect or distort the figures in the financial statement, which in turn is reflected in the ratio
3. Using financial ratio to assess the company is not good enough, the company's management also must be looked
4. The company can doctor its accounts to make its accounting attractive, which will affect the valuation of the financial ratios.
- It measures how much free cash the company can generate after deducting the company's capital expenditures
- Ideal Range:6% or above
Margin of Safety

- V= Intrinsic Value, P=Current Share Price
- It is the amount in which the company's shares are trading below the intrinsic value, which is expressed in percentage
- Ideal Range: A higher margin of safety means there is greater protection for an investor if the share price falls due to falling revenue
- The general rule of thumb for Margin of Safety
- 50% Margin of Safety means the stock is undervalued
- 0% Margin of Safety means the stock is trading at fair value
- -50% Margin of safety means the stock is overvalued
While an investor can use financial ratios to evaluate how the business is performing over time, there are certain important points that investors must take note of:
1. Compare the financial ratio within the same industry. This is very important. For example, a different ratio is used to evaluate a food and beverage company compared to an asset-based company
2. Inflation can badly affect or distort the figures in the financial statement, which in turn is reflected in the ratio
3. Using financial ratio to assess the company is not good enough, the company's management also must be looked
4. The company can doctor its accounts to make its accounting attractive, which will affect the valuation of the financial ratios.
Hope you enjoy reading through these few post as financial statement do bore the sh*t out of many people(Including me!).
That''s all for How to read financial statement and financial ratio!
Good day !
ReplyDeleteWe are Christian Organization formed to help people in need of help,such as
financial assistance, Do you need a loan to pay your bills? Do you need
Personal Business Car or Student loans? Need a loan for various other
purposes? If yes contact us today.
Please these is for serious minded and God fearing People Only.
Email: jacksonwaltonloancompany@gmail.com
Text or call: +1-205-5882-592.
Address is 68 Fremont Ave Penrose CO, 81240.