In my previous post on Learning investing/trading together,I mention on using the SGX stock screener to determine whether to invest/trade a company using SGX stockscreener.
Why use SGX stock screener?
- Computer will perform the calculation of the financial ratios,save time on our part(not many of us has the luxury of looking through financial statement of companies all day long,that is if reading the financial statement doesn't bored us!)
- One stop platform to get the financial ratios of a particular SGX company
So,let begin using SGX stock screener (Note:I will be using Singpost (S08 as a example)
1.Go to Stock screener website,you will be brought to the below page
2.Click on the search stock to type the company you want to search( In this case,I can either type Singpost or its stock code S08
3.In my case,I type singpost, and its show 1 result for singpost
4.Scroll down and click on singpost
6.Scroll down to get company information
7. Determine the financial ratio to evaluate a company
Everyone has a different set of financial ratios they use to evaluate a company,in my case i will generally use these few financial ratios,below are the recap of financial ratio from the previous post
Price/book ratio

7. Determine the financial ratio to evaluate a company
Everyone has a different set of financial ratios they use to evaluate a company,in my case i will generally use these few financial ratios,below are the recap of financial ratio from the previous post
Price/book ratio
- It measures the company's market price to its book value. Book Value represents the total amount that would be left over after the company sell off its assets and repaid all of its liabilities
- Low PB ratio may mean the company is undervalued. The PB ratio is used to evaluate the assets of each company such as property companies.
- Ideal Range:Any value under 1.0 is considered a good P/B value, indicating a potentially undervalued stock.

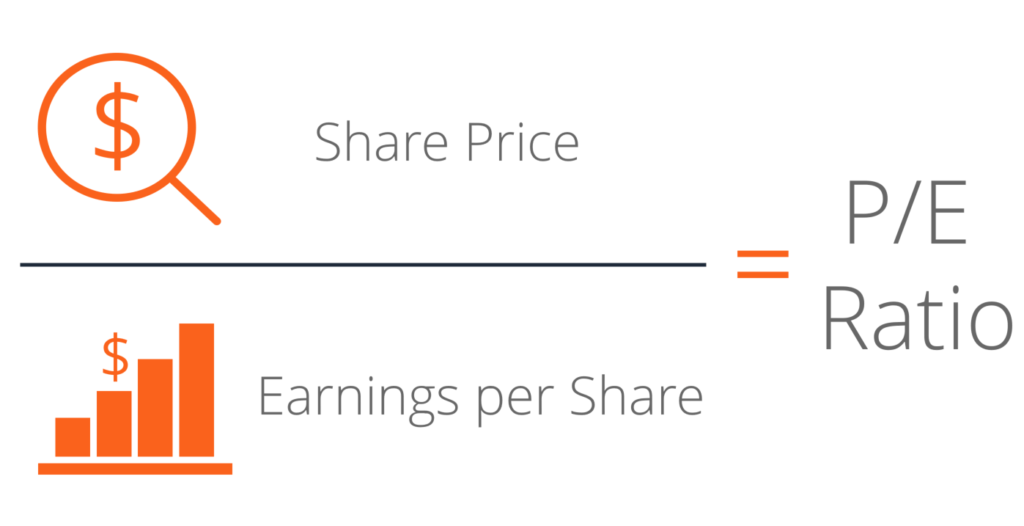
- It measures the share price relative to the company's earnings. A higher PE means investors are expecting better future earning or growth
- High PE=20 and above
- Average PE=11 to 20
- Low PE=1 to 10
- Average Market PE=15
- Ideal Range=It is better to buy a stock with lower PE ratio assuming all things being equal
- As the stock price goes up, the P/E ratio goes up
- As the stock price goes down, the P/E ratio goes down
- As a company’s earnings go up, the P/E ratio goes down
- As a company’s earnings go down, the The P/E ratio always equals the number of years it would take in earnings per share to equal the current price of the stock. So if the ratio is 20, it would take 20 years of current earnings to equal the current price of the stock.P/E ratio goes up
- Compare within the same industry
Current Ratio
- A simple ratio of current asset divide by current liabilities
- Current liabilities are debt that need to clear in the short term(in a year)
- If a company has a current ratio less then 1.0, do not invest in it
- If a company has a current ratio more then 2.0, May consider investing in it
- The higher the current ratio, the better
Quick ratio
- Quick ratio is used to determine if the company has enough short term assets to sell to cover its current liabilities(debt)
- The quick ratio is almost similar to current ratio except that it is assumed that the company does not sell its inventories(e.g Toyota inventory is its car) or stock, it is still able to fulfill its debt
- If the company has a quick ratio of 0.75 and below, do not invest in it
- If the company has a quick ratio of 1.25 and above, May consider investing in it
- The higher the quick ratio the better
Debt to equity
:max_bytes(150000):strip_icc()/debt_to_equity_-5bfd8742c9e77c0058b60440)
- This is an important ratio and it will determine if you are evaluating a highly gear company. Companies with high borrowing are subjected to higher risk than companies with no or low debt. Investors would look at this ratio to determine the company's ability to repay its debt
- It measures the total liabilities to total shareholder equity. A higher ratio could mean the company is higher financed by debt
- Ideal Range: 2.0 or less
Earning Per share


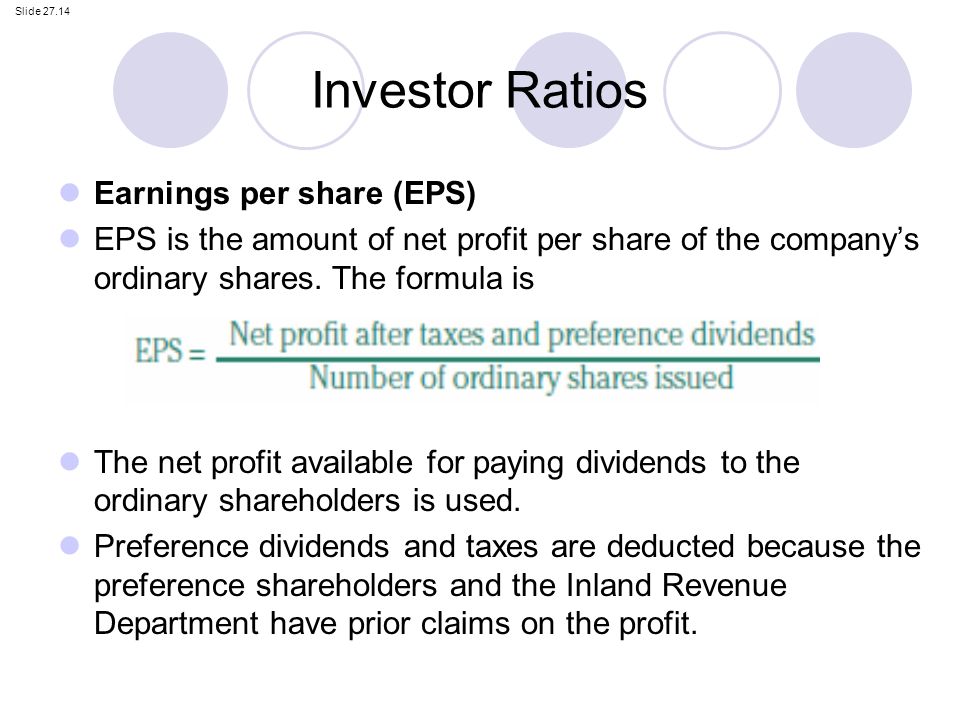
- It measures how profitable a company is on a shareholder basis. The higher the EPS,the more profitable the company is
- When earnings per share is negative, it means the company is losing money.
- Ideal range: Go for consistent and stable or growing EPS.
For Price/Book and Price/earning ratio,click on Valuation tab
Price /Book ratio remark for Singpost(S08)
- Singpost Price/Book value is at 1.353,
- Ideal Range of Price:Any value under 1.0 is considered a good P/B value, indicating a potentially undervalued stock.
- Since it is above 1,hence you can either consider it as a slightly expensive stock
- A red flag!
Price/Earning ratio remark for Singpost(S08)
- Singpost Price/Earning ratio:263.857
- Crazy Price/Earning ratio,Consider to be high
- The P/E ratio always equals the number of years it would take in earnings per share to equal the current price of the stock. So if the ratio is 20, it would take 20 years of current earnings to equal the current price of the stock.P/E ratio goes up
- To put it simply,Do you think singpost can increase its share price x 200?I think not
- Definitely a red flag!!
For current ratio,quick ratio, debt/equity ratio,EPS 5 yr growth,click on financial tab
Current ratio remark for Singpost(S08)
- Singpost current ratio:0.806
- If a company has a current ratio less then 1.0, do not invest in it
- If a company has a current ratio more then 2.0, May consider investing in it
- The higher the current ratio, the better
- current ratio not above 2.0,avoid it!
- Another red flag!
Quick ratio remark for Singpost(S08)
- Singpost quick ratio:0.805
- If the company has a quick ratio of 0.75 and below, do not invest in it
- If the company has a quick ratio of 1.25 and above, May consider investing in it
- The higher the quick ratio the better
- Quick ratio is not above 1.25
- Another red flag!
Long term debt/equity remark for Singpost(S08)
- Singpost debt/equity ratio:0.56
- It measures the total liabilities to total shareholder equity. A higher ratio could mean the company is higher financed by debt
- Ideal Range: 2.0 or less
- Debt/equity ratio is 0.55,which is less than 2.0
- Finally, a good indicator !
Eps five year growth remark for Singpost(S08)
- Singpost EPS five year growth: -38.122
- When earnings per share is negative, it means the company is losing money.
- Another red flag!
Conclusion
The six financial ratio i used to evaluate singpost are: Price/Book ,Price/earning ratio, current ratio,quick ratio, debt/equity ratio,EPS 5 year growth
As you can see above,only one out of all the six financial ratio criteria i used to evaluate signpost is met,hence singpost is not a good buy.
One last note: Different people may used different financial ratio to evaluate a company,there is really no fix formula for evaluating a company ,hence always dyodd!(do your own due diligence)


