Tuesday, 19 November 2019

[Post 97] Learning investing/trading together part 22:How to purchase a stock?(FSM)

In the last Learning investing/trading post,i mention that i have started open an account with FundSuperMart(FSM),which has the lowest brokerage cost in Singapore(0.08% or a minimum of $10)

Surprisingly,the sign up process was easy using Singpass account and in about one day, i open a brokerage account with FSM.


So,why choose FSM as a brokerage?


  • Cheapest stock brokerages fees in Singapore at (0.08% or a minimum of $10)
  • Good customer service,asked some queries on the account fee using the chat interface and was  answer promptly
Cons
  • No physical bank(Yes,some people prefer a brick and mortar bank)
  • Must transfer money to FSM and they will update your account balance(Updating of balance in account generally takes an hour not immediate)
  • Let's say you transfer $4000 at 3 PM to your FSM account,only at 4 PM then your account balance will show that you have $4000 transfer in
How to set up a FSM account?
  • You can choose to Sign up with a Singpost account or sign up normally and you are done,quick and easy!
Onto the step by step guide on how to purchase a stock via FSM!


Step 1)Transfer money into your FSM Account


How much to transfer? 


  • Well, it depends on how much your budget to purchase those stock and whether you have enough in your bank
  • Currently, the Brokerage charges for FSM (Singapore):0.08%, min $10
  • SCB charges 0.2% or minimum $10
  • DBS vickers cash upfront charges 0.12% or minimum $10
  • if you are investing up to $5,000, you can either use DBS Vickers or SCB or FSM.
  • If you are investing above $5,000 and up to $8,333.34, use either DBS Vickers Cash Upfront or FSM.
  • If you are investing above $8,888.34, use FSM.
  • ***Note: You can invest in any amount you like it need not be $5,000, in my personal case I use either $3000 or $5000 or $7000
  • So you have decided the amount? What's next?
    • Transfer the money, of course!
1. Log in to your FSM account, and you will reach the below page

2.Take note of your personal account number,you will use the number to transfer money into your FSM account from your respective bank(Red Box)


3.Go to this link:https://secure.fundsupermart.com/fsm/new-to-fsm/parking-facility/making-payments,scroll down to making payments and select the bank that you want to transfer the money from e.g DBS


4.Follow the instructions above,remember to key in your personal account number from FSM in the comments for Recipient

5.After transferring,you have to typically wait from 30 mins to an hr for the balance to be reflected in your FSM Account holdings

Step 2)Time to buy some stock!

6.Click stocks then Live trading(red box)


7.You will be brought to the below page,key in the stock code that you would like to purchase e.g S08 SINGPOST (red box)


9.After clicking buy,the order form will appear,key in the the quantity of the stock that you would like to purchase


I am pretty sure everyone who has follow my blog are now familar with the various term,but nevertheless here are some key term


The terms are taken from this post, a while back,some important terms are...

Last done
  • Last action-how much was this share bought or sold for
Bid
  • Bid-how much someone is willing to pay for the share(Someone want to buy the share at a price of 0.9350)
Offer or Ask
  •  Ask is the price a seller is willing to sell the share(someone want to sell his his share at a price of 0.9400)
Bid vol
  • Bid qty,someone make a bid to buy 683,800 shares at 0.9350 for each share
Offer or Ask vol
  • Offer vol is someone selling his 760,400 shares at 0.9400 for each share
*As taken from here: When a market is experiencing more buying volume than selling volume, it means that there are more traders buying at the ask price, which has a tendency to push the price up.
When a market is experiencing more selling volume than buying volume, it means that there are more traders selling at the bid price, which has a tendency to push the price down.
Chg or change:
  • For a stock or bond quote, change is the difference between the current price and the last trade of the previous day
Day High:
  • Today highest price for the stock so far
Day Low:
  • Today lowest price for the stock so far
Order quantity:
  • I have key in 100 shares
    SGX(lot size)=100 shares
Order type:
  • The below chart does a good job of explaining the various order type
  • Market order-Buy or sell at the current Ask price(Order get filled immediately)
  • Limit order-Buy or sell at a specific price(Order filled depend on the price you key in, will explain later in the post)
  • Always choose Limit order!!!


Order consideration
  • (Quantity x Price ) + SGX Fees and charges
10) Click preview order,the comfirm form will appear

                                     
Stock name:
  • Stock code as the name implies, SPDR STI ETF(ES3)
A/C :
  • should have been auto fill
Action:
  • Click buy to buy stocks and click if you are selling the stock
Order type
  • As explained above,limit order
Validity(until):
  • A Day order is a limit order good for that business day only. If the order is not filled by the end of the trading day, the order will expire. 
  • This is the order we are going for, for simplicity sake.
Order quantity:
  • I have key in 100 shares
  • SGX(lot size)=100 shares
Order price:
  • The price that i want to buy the shares at,0.9400
Estimated Fee
  • Total :$10.74
  • Order value(100%)=$94.00
  • SGX trading fee(0.0075%)=$0.024555
  • Clearing fee(0.0325%)=$0.106405
  • GST is 7% of Comission + Clearing fee + SGX trading fee 
  • GST=$0.7091672
  • Hence,estimated fee= $10 + 0.024555 + 0.106406 + 0.7091672=$10.74
  • Do refer to DBS vickers post if still unsure
Pretty easy right?Do watch out for my next post,thanks for reading!

Friday, 11 October 2019

[Post 96] Learning investing/trading together part 21:How to purchase a stock?(Standard chartered) part 2

Continue from the last Learning investing/trading together post ...


Some key term to note...

Trading A/C No:
  • should have been auto fill
Counter code:
  • Stock code as the name implies, SPDR STI ETF(ES3)
Action:
  • Click buy to buy stocks and click if you are selling the stock
Order quantity:
  • 100=SGX( 1 lot size)
Buy order price:
  • The price that i want to buy the shares at
Order value:
  • Order quantity x Buy order price
Order type:
  • The below chart does a good job of explaining the various order type
  • Market order-Buy or sell at the current Ask price(Order get filled immediately)
  • Limit order-Buy or sell at a specific price(Order filled depend on the price you key in, will explain later in the post)
  • Always choose Limit order!!!
Valid for(until):
  • A Day order is a limit order good for that business day only. If the order is not filled by the end of the trading day, the order will expire. 
  • This is the order we are going for, for simplicity sake.
Settlement amount:
  • The settlement account should be fixed
9)Key in order quantity

I have key in 100 shares
SGX(lot size)=100 shares

10)Key in the Buy order price

The price that I would like to bid:$3.274

You may ask why $3.274?

Remember the offer from the last post,which states 3.275?
  • What i am doing here is trying to bid lower at 3.275 by putting the bid price at $3.274 but... this may not get my order to fulfill instantly and my order will be added to the queue
  • This is like trying to bargain with a shop seller at a market to buy an item(e.g fish) which is stated as selling for $3.275, but you want to buy it cheaper at $3.274
Can you bid at 3.275 or higher?
  • Yes, you can put the bid price at $3.275 or higher(Note: this will get your order fill instantly because you are purchasing the stock at the selling price(Ask or Offer))
  • This is just like buying an item (e.g fish) at a stated price from the shop seller at the market without any question asked, you hand over your money and off you go
What does it mean by having my order added to the queue?
  • Since there is no seller willing to sell(ask) at the price you want(bid), your order is added to a queue
  • A queue is like a database where they store everybody offer whose order is not filled, the order is more likely to fill quickly if you key in the price nearer to their Ask price(selling price)
11)Click the submit button after keying in,you will be shown the confirmation form below 


A few more key term to note...


Order Value
  • $327.40
Total Fees
  • I mentioned before in my post a few ago about the standard commission
  • Currently, the brokerage fee for DBS cash upfront account is 0.18%, min SGD10
Clearing fee

  • Not shown,refer to DBS vickers post
  • Total Contract Value(100%)=$327.40
  • Clearing fee(0.0325%)=$0.106405
SGX trading fee

  • Not shown,refer to DBS vickers post
  • Total Contract Value(100%)=$327.40
  • SGX trading fee(0.0075%)=$0.024555
GST
  • Not shown,refer to DBS vickers post 
  • GST is 7% of Comission + Clearing fee + SGX trading fee 
  • GST=7%(the magic number)
  • Commission + Clearing fee + SGX trading fee =100%
  • $10.00 + $0.106405+ $0.024555=100%
  • 100%=$10.13096
  • GST=$0.7091672
Total Fees

  • Not shown,but you can calculate from the above figures
  • Commission + Clearing fee + SGX trading fee + GST=Total Comission and fees
  • $10.00 + $0.106405 + $0.024555 + $0.7091672= $10.8401272
  • Total Comission and fee = $10.84
Total amount

  • Order Value + Total Fees =Total amount
  • $327.40 + $10.84 = $338.24
  • Indicative total proceed=$338.24

*Do note that all live prices have a ten minute delay,if you would like updated live price,i you have to call up standard chartered to arrange for it,you will have to pay extra cash for it though:)


I will not proceed with the next step as it means that I have purchased a stock. Hope you all learn something from my post, do watch out for my next post:)

Tuesday, 24 September 2019

[Post 95] Learning investing/trading together part 20:How to purchase a stock?(Standard chartered)

Learning investing/trading together part 20:How to purchase a stock?(Standard chartered)

I mentioned before that i am currently using DBS vickers and Standard chartered as my brokerage.Recently, I have also sign up for FundSuperMart due to the low fees of 0.08% or a minimum of $10(but that's a story for another day)

This post will be on how to purchase stock with standard chartered.

So,why choose standard chartered as a brokerage?
  • Brokerage charges for standard chartered online and mobile trades:0.20%, min $10
  • 0.20%/100=0.002
  • $10/0.002=$5000
  • The minimum amount that one should invest in each trade should be more than $5,000
  • The purchasing power will be updated immediately after you sell your stock!
How to set up a standard chartered account?
  1. Head down to the nearest standard chartered bank branch 
  2. Open up an saving account(For more information about the various saving account you can open with standard chartered,please refer to this link,Personally,i opened a E saver account where it require a min deposit amount of $1000)
  3. Do open an securities settlement account with different currency(US,JPY) to have to option to invest in other countries market at no extra charge,specifically tell them you are opening an account to invest
 Onto the step by step guide on how to purchase a stock via standard chartered!

Step 1)Transfer money into your standard chartered account

How much to transfer? 
  • Well, it depends on how much your budget to purchase those stock and whether you have enough in your bank
  • Currently, the Brokerage charges for standard chartered online and mobile trades:0.20%, min $10
  • DBS cash upfront charges 0.12% or minimum $10
  • FSM charges 0.08% or minimum $10
  • if you are investing up to $5,000, you can either use DBS Vickers or SCB or FSM.
  • If you are investing above $5,000 and up to $8,333.34, use either DBS Vickers Cash Upfront or FSM.
  • If you are investing above $8,888.34, use FSM.
  • ***Note: You can invest in any amount you like it need not be $5,000, in my personal case I use either $3000 or $5000 or $7000
So you have decided the amount? What's next?
  • Transfer the money, of course!

1. Log in to standard charted bank account,you reach the below page

2.Transfer Fund from your E$aver A/C to your SECURITIES SETTLEMENT ACCOUNT by clicking Transfer Fund(Red box)

3.Click Between Own Account

4.You will be asked to authenticate your account,after authenticating you will be brought to the transfer between own account page

Transfer to: Local Own Account
Account to be Transferred to: E$Aver A/C
Account to be Transferred from:SECURITIES SETTLEMENT ACCOUNT
Currency and Amount:SGD ,any amount that your wish to transfer(e.g 5000.00)
Description: None

5.Check the detail and click confirm(black box)


Step 2)Time to buy some stock!

6)Click MENU then click Online Trading


7.You will then be brought to the below page,the place order is at the right side of the page


8.Key in the counter code(e.g ES3) and Scroll down to check the detail of the bid and ask price


So, in my case I enter in the code: ES3(STI ETF)*Take note, this is different from the other STI ETF that you purchase with POSB invest saver(For more information about the difference between the two ETF, read here)

The terms are taken from this post, a while back,some important terms are...

Last
  • Last action-how much was this share bought or sold for
Bid
  • Bid-how much someone is willing to pay for the share(Someone want to buy the share at a price of 3.267)
Offer or Ask
  •  Ask is the price a seller is willing to sell the share(someone want to sell his his share at a price of 3.275)
Bid qty
  • Bid qty,someone make a bid to buy 100 shares at 3.267 for each share
Offer or Ask qty
  • Offer vol is someone selling his 3200 shares at 3.275 for each share
*As taken from here: When a market is experiencing more buying volume than selling volume, it means that there are more traders buying at the ask price, which has a tendency to push the price up.
When a market is experiencing more selling volume than buying volume, it means that there are more traders selling at the bid price, which has a tendency to push the price down.
Chg or change
  • For a stock or bond quote, change is the difference between the current price and the last trade of the previous day
Day High
  • Today highest price for the stock so far
Day Low
  • Today lowest price for the stock so far
Will continue at the next Learning investing/trading together post!

Saturday, 31 August 2019

[Post 94] Learning investing/trading together part 19:How to determine whether to invest or trade a company using SGX stock screener

How to determine whether to invest or trade a company using SGX stockscreener?

In my previous post on Learning investing/trading together,I mention on using the SGX stock screener to determine whether to invest/trade a company using SGX stockscreener.

Why use SGX stock screener?
  • Computer will perform the calculation of the financial ratios,save time on our part(not many of us has the luxury of looking through financial statement of companies all day long,that is if reading the financial statement doesn't bored us!)
  • One stop platform to get the financial ratios of a particular SGX company
So,let begin using SGX stock screener (Note:I will be using Singpost (S08 as  a example)

1.Go to Stock screener website,you will be brought to the below page
2.Click on the search stock to type the company you want to search( In this case,I can either type Singpost or its stock code S08


3.In my case,I type singpost, and its show 1 result for singpost
4.Scroll down and click on singpost

5.Scroll down and Click on the tab financial to see the financial ratio

6.Scroll down to get company information
7. Determine the financial ratio to evaluate a company 

Everyone has a different set of financial ratios they use to evaluate a company,in my case i will generally use these few financial ratios,below are the recap of financial ratio from the previous post

Price/book ratio


  • It measures the company's market price to its book value. Book Value represents the total amount that would be left over after the company sell off its assets and repaid all of its liabilities
  • Low PB ratio may mean the company is undervalued. The PB ratio is used to evaluate the assets of each company such as property companies.
  • Ideal Range:Any value under 1.0 is considered a good P/B value, indicating a potentially undervalued stock.
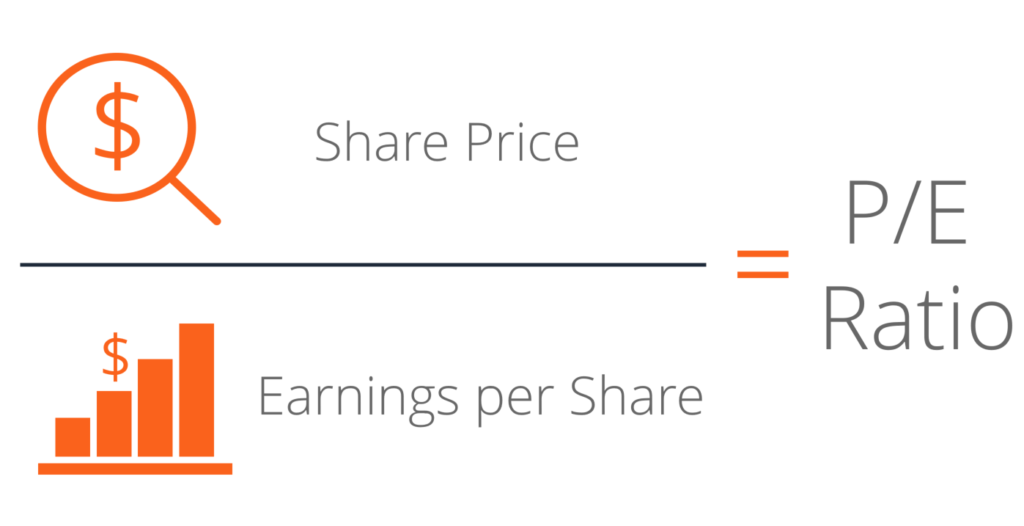
Price/Earning ratio
Image result for price to earning ratio
  • It measures the share price relative to the company's earnings. A higher PE means investors are expecting better future earning or growth
  • High PE=20 and above
  • Average PE=11 to 20
  • Low PE=1 to 10
  • Average Market PE=15
  • Ideal Range=It is better to buy a stock with lower PE ratio assuming all things being equal
  • As the stock price goes up, the P/E ratio goes up
  • As the stock price goes down, the P/E ratio goes down
  • As a company’s earnings go up, the P/E ratio goes down
  • As a company’s earnings go down, the The P/E ratio always equals the number of years it would take in earnings per share to equal the current price of the stock. So if the ratio is 20, it would take 20 years of current earnings to equal the current price of thstock.P/E ratio goes up
  • Compare within the same industry
Current Ratio


  • A simple ratio of current asset divide by current liabilities
  • Current liabilities are debt that need to clear in the short term(in a year)
  • If a company has a current ratio less then 1.0, do not invest in it
  • If a company has a current ratio more then 2.0, May consider investing in it
  • The higher the current ratio, the better
Quick ratio
  • Quick ratio is used to determine if the company has enough short term assets to sell to cover its current liabilities(debt)
  • The quick ratio is almost similar to current ratio except that it is assumed that the company does not sell its inventories(e.g Toyota inventory is its car) or stock, it is still able to fulfill its debt
  • If the company has a quick ratio of 0.75 and below, do not invest in it
  • If the company has a quick ratio of 1.25 and above, May consider investing in it
  • The higher the quick ratio the better
Debt to equity
Image result for debt to equity ratio

  • This is an important ratio and it will determine if you are evaluating a highly gear company. Companies with high borrowing are subjected to higher risk than companies with no or low debt. Investors would look at this ratio to determine the company's ability to repay its debt
  • It measures the total liabilities to total shareholder equity. A higher ratio could mean the company is higher financed by debt
  • Ideal Range: 2.0 or less
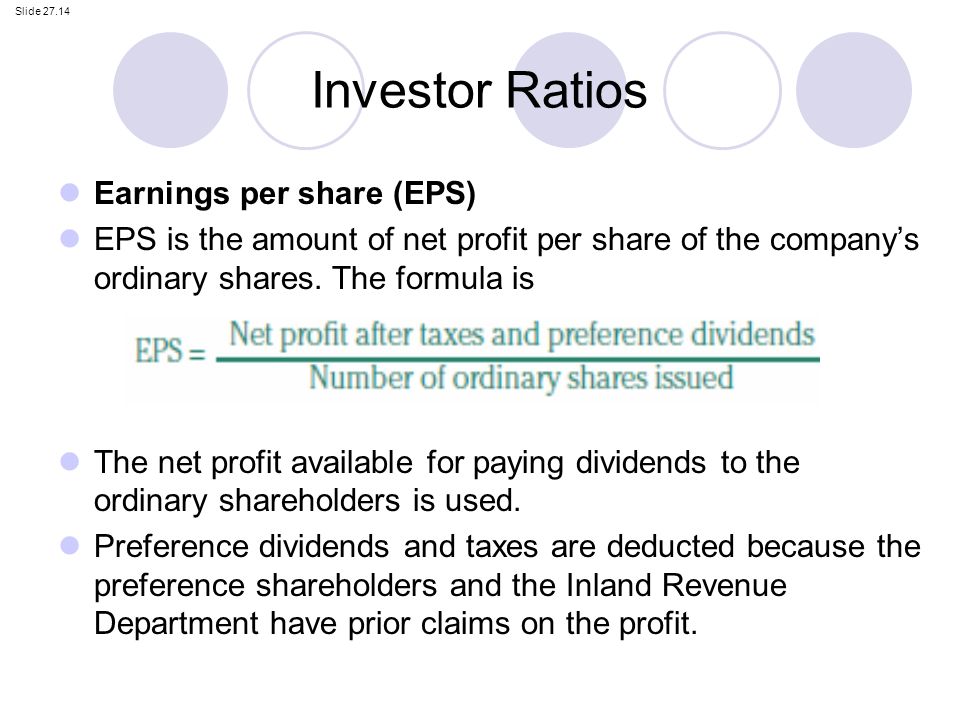
Earning Per share
Image result for earning per share formula

  • It measures how profitable a company is on a shareholder basis. The higher the EPS,the more profitable the company is
  • When earnings per share is negative, it means the company is losing money. 
  • Ideal range: Go for consistent and stable or growing EPS.
For Price/Book and Price/earning ratio,click on Valuation tab

Price /Book ratio remark for Singpost(S08)
  • Singpost Price/Book value is at 1.353, 
  • Ideal Range of Price:Any value under 1.0 is considered a good P/B value, indicating a potentially undervalued stock.
  • Since it is above 1,hence you can either consider it as a slightly expensive stock
  • A red flag!
Price/Earning ratio remark for Singpost(S08)
  • Singpost Price/Earning ratio:263.857
  • Crazy Price/Earning ratio,Consider to be high
  • The P/E ratio always equals the number of years it would take in earnings per share to equal the current price of the stock. So if the ratio is 20, it would take 20 years of current earnings to equal the current price of thstock.P/E ratio goes up
  • To put it simply,Do you think singpost can increase its share price x 200?I think not
  • Definitely a red flag!!
For current ratio,quick ratio, debt/equity ratio,EPS 5 yr growth,click on financial tab


Current ratio remark for Singpost(S08)
  • Singpost current ratio:0.806
  • If a company has a current ratio less then 1.0, do not invest in it
  • If a company has a current ratio more then 2.0, May consider investing in it
  • The higher the current ratio, the better
  • current ratio not above 2.0,avoid it!
  • Another red flag!
Quick ratio remark for Singpost(S08)
  • Singpost quick ratio:0.805
  • If the company has a quick ratio of 0.75 and below, do not invest in it
  • If the company has a quick ratio of 1.25 and above, May consider investing in it
  • The higher the quick ratio the better
  • Quick ratio is not above 1.25
  • Another red flag!
Long term debt/equity remark for Singpost(S08)
  • Singpost debt/equity ratio:0.56
  • It measures the total liabilities to total shareholder equity. A higher ratio could mean the company is higher financed by debt
  • Ideal Range: 2.0 or less
  • Debt/equity ratio is 0.55,which is less than 2.0
  • Finally, a good indicator !
Eps five year growth remark for Singpost(S08)
  • Singpost EPS five year growth: -38.122
  • When earnings per share is negative, it means the company is losing money. 
  • Another red flag!
Conclusion

The six financial ratio i used to evaluate singpost are: Price/Book ,Price/earning ratio, current ratio,quick ratio, debt/equity ratio,EPS 5 year growth

As you can see above,only one out of all the six financial ratio criteria i used to evaluate signpost is met,hence singpost is not a good buy.

One last note: Different people may used different financial ratio to evaluate a company,there is really no fix formula for evaluating a company ,hence always dyodd!(do your own due diligence) 

Saturday, 29 June 2019

[Post 93]Learning investing/trading together part 18:How to read financial statements and financial ratio part 3

Continue on from the last post here...

3.Debt

Debt to equity
Image result for debt to equity ratio

  • This is an important ratio and it will determine if you are evaluating a highly gear company. Companies with high borrowing are subjected to higher risk than companies with no or low debt. Investors would look at this ratio to determine the company's ability to repay its debt
  • It measures the total liabilities to total shareholder equity. A higher ratio could mean the company is higher financed by debt
  • Ideal Range: 2.0 or less

Debt to Net Profit


  • Debt to Net Profit=Total Debt/Net Profit
  • It measures the company's debt to its net profit
  • Ideal range:3.0 or less


Debt to Cash Flow


  • Debt to Cash Flow=Total Debt/Operating Cash Flow
  • It measures the company's debt to its operating cash flow.It is an indication of the company's ability to cover its total debt with its annual operating cash flow
  • Ideal range: 3.0 or less
Interest Cover
Image result for interest cover
  • It measures the company's ability to pay the interest expenses with sales
  • Ideal Range:1.5 or more
Net Gearing

  • Net Gearing =(Total Debt - Cash)/Shareholder Equity
  • It measures the company's debt to its shareholder equity, The higher the ratio, the more debt and risk the company has
  • Ideal Range:0.5 or less

4.Efficiency

Inventory Turnover 


  • Inventory Turnover= Inventory/(Costs of Good sold x 365 days)
  • It measures how many days it takes to sell the inventory
  • Ideal Range: The lower the number of days the better
Creditors


Image result for creditor formula
  • It indicates how many days the company takes to pay its creditor
  • Ideal Range: The higher number of days is ideal as the company can roll its cash flow but it also means that the company has cash flow problems and cannot pay off its debt
Debtors
Image result for debtor formula
  • It indicates how many days it takes the company to collect its debt from its debtors
  • Ideal Range: The lower the number of days the better
Others

Earning Per share
Image result for earning per share formula

  • It measures how profitable a company is on a shareholder basis. The higher the EPS,the more profitable the company is
  • When earnings per share is negative, it means the company is losing money. 
  • Ideal range: Go for consistent and stable or growing EPS.
Dividend Yield


Image result for dividend yield formula


  • It measures how much dividend the company is paying out compared to stock price.
  • Ideal Range: Go for consistent dividends in the range of 5% to 8%
Price to Earnings(PE)
Image result for price to earning ratio
  • It measures the share price relative to the company's earnings. A higher PE means investors are expecting better future earning or growth
  • High PE=20 and above
  • Average PE=11 to 20
  • Low PE=1 to 10
  • Average Market PE=15
  • Ideal Range=It is better to buy a stock with lower PE ratio assuming all things being equal
  • As the stock price goes up, the P/E ratio goes up
  • As the stock price goes down, the P/E ratio goes down
  • As a company’s earnings go up, the P/E ratio goes down
  • As a company’s earnings go down, the The P/E ratio always equals the number of years it would take in earnings per share to equal the current price of the stock. So if the ratio is 20, it would take 20 years of current earnings to equal the current price of the stock.P/E ratio goes up
  • Compare within the same industry
Price to Book(PB) 


  • It measures the company's market price to its book value. Book Value represents the total amount that would be left over after the company sell off its assets and repaid all of its liabilities
  • Ideal Range: Low PB ratio may mean the company is undervalued. The PB ratio is used to evaluate the assets of each company such as property companies.
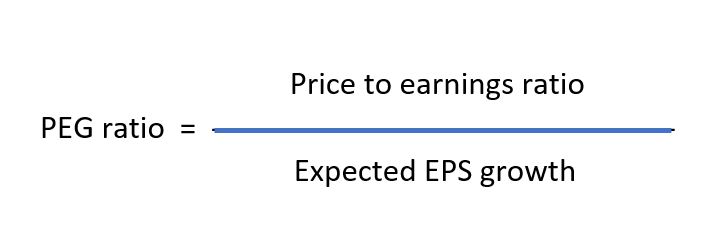
Price to Earnings Growth(PEG)

Image result for Price to Earnings Growth(
*Expected EPS growth is also known as Annual EPS growth


  • It measures the company's value to the company future growth
  • A lower PEG may mean the stock is undervalued
  • Ideal Range:0.5 or less
Free Cash Flow Ratio


Image result for free cash flow ratio formula
  • It measures how much free cash the company can generate after deducting the company's capital expenditures
  • Ideal Range:6% or above

Margin of Safety


  • V= Intrinsic Value, P=Current Share Price
  • It is the amount in which the company's shares are trading below the intrinsic value, which is expressed in percentage
  • Ideal Range: A higher margin of safety means there is greater protection for an investor if the share price falls due to falling revenue
  • The general rule of thumb for Margin of Safety
  • 50% Margin of Safety means the stock is undervalued
  • 0% Margin of Safety means the stock is trading at fair value
  • -50% Margin of safety means the stock is overvalued
Understanding financial ratios is a key skill for any investor. Financial ratios illustrate the strength and weakness of a business

While an investor can use financial ratios to evaluate how the business is performing over time, there are certain important points that investors must take note of:

1. Compare the financial ratio within the same industry. This is very important. For example, a different ratio is used to evaluate a food and beverage company compared to an asset-based company

2. Inflation can badly affect or distort the figures in the financial statement, which in turn is reflected in the ratio

3. Using financial ratio to assess the company is not good enough, the company's management also must be looked

4. The company can doctor its accounts to make its accounting attractive, which will affect the valuation of the financial ratios.

Hope you enjoy reading through these few post as financial statement do bore the sh*t out of many people(Including me!).

That''s all for How to read financial statement and financial ratio! 

Tuesday, 11 June 2019

[Post 92] How to properly valuate a company?

Credit to growth investor from investing note(investing note has lots of good tidbits)

These are the valuation metrics that are commonly used:
- Price to Earnings Ratio (P/E)
- Price to Book Ratio (P/B)
- Discounted Cash Flows (DCF)
- and others…

P/E: This is the simplest of all. It is simply = Share Price divided by Earnings Per Share (EPS).
Trailing P/E refers to Current Share Price divided by the EPS over the past 12 months.
Forward P/E refers to Current Share Price divided by the forecasted EPS for the next 12 months.

A layman’s interpretation of P/E is how much I am willing to pay for the company’s earnings. Example: A P/E of 15 means I am willing to pay 15 times per share for its earnings.

To me, P/E by itself is quite meaningless. It is useful only if you compare the company to its peers’ P/E or the industry average P/E, to judge whether it is under or overvalued.

P/B: Book value is the amount of cash I would get if I were to liquidate the company *today*. It’s like the “net worth” of a company. It is the sum of assets minus total liabilities. Sometimes “Net Asset Value” is used loosely interchangeably as “book value”. Book value per share is simply the book value divided by the total number of shares. P/B is thus Share Price divided by Book Value per share.

A P/B smaller than 1 means the share price is undervalued in terms of book value, while a P/B greater than 1 means overvalued. A P/B ratio < 1 simply provides an assurance to the shareholder that he/she can get back all (in theory) of his invested capital if the company was to go bankrupt.

Simplified Example: If I pay $1 for a share of a company with a P/B of 0.5, and if the company was to be liquidated today, I will in theory get back $2 as a shareholder. In practice this may be less than $2 due to expenses for liquidation and other factors. On the contrary, if I bought a share worth $1 of a company with a P/B of 2, I will at most get back $0.50 if the company was liquidated.

In summary, P/B looks at the value of a company at the point in time when the book value and P/B ratio were calculated.

The problems with using P/B is that it does not take into account the *future* earnings of the company and assumes the total value of its assets is correctly calculated. A company with a P/B ratio of 0.5 does NOT necessarily mean it’s a wonderful company with strong revenue growth.

There are many companies whose P/B ratios remain quite constant through the years. Eg. property development companies.

DCF: This refers to the sum of future Free Cash Flows (FCFs) that can be potentially generated by a company, discounted to present value. It is typically used by value investors to calculate a DCF-based fair value.

To understand this, you need to know the concept of “the time value of money”. In layman’s terms, “time value” refers to the fact that a dollar today may not be worth a dollar in the future due to inflation or deflation. So if a company can generate $2 mill of FCF in the future, I need to discount it to present value to assess what this future $2 m is worth today.

The simplified formula of a DCF-based fair value = Sum of Discounted FCFs divided by number of shares. The calculation can be much more complex due to what is the correct discount rate and the growth rate of FCF to use.

The advantage of using this is that I can judge a company’s worth or fair value by taking into account its future FCF growth (i.e. earnings growth). It definitely provides a more accurate view of a company’s future vs P/B ratio.

The downside of using DCF is that it is very sensitive to the inputs you use (discount rate, growth rate, etc.), hence “garbage in, garbage out”. The calculated fair value can vary a lot based on the input parameters. Also the psychological aspects -- sometimes we may tweak the inputs to our liking subconsciously, hence deriving an overly optimistic fair value.

As stock prices are typically driven by strong revenue growth (as per my observation), using DCF-based fair value will be more appropriate over P/B ratio if you want to maximise investment returns.

In conclusion, P/E and P/B ratios provide a very limited view of a company’s future growth. DCF valuation is often more appropriate. Having said all these, valuation metrics still pretty much serve as a rough estimation and guideline only. In reality, the market may be irrational (esp in the short-term) and many participants do not obey valuation metrics.

Hope this helps!