Note:The Cash flow statement are taken from Singpost(S08),yahoo Finance
Cash Flow Statement
- Cash Flow Statement show the flow of cash in and out of the business
- It is broken down into operating, financing and investing activities
Cash Flow:Operating Activities
- Operating activities include manufacturing, selling and delivering the product of the company as well as collecting payment from its customers.
- This could include the purchase of raw materials, inventory building, advertising, and product shipping.
- The higher the cash flow of operations, the stronger the company is. Investors love strong cash flow companies.
Cash Flow:Financing Activities
Important: You will find the word "Note" with the numbered item below as you go through the actual accounting numbers in the annual report. Please read the notes as they reveal important information about certain items.
Cash Flow: Investing Activities
Note:If the expediture (purchase of property, plant and equipment) increases, you may want to investigate whether the company's revenue also increases. If expenditure increases but income does not increase, the investor should be careful
Financial ratio are generally divided into five different categories
1)Liquidity,
2)Profitability


- What interest investor the most in this part of the statement is the dividends.
- It means good news for the investor if the company pays consistent dividends.
- This statement shows the cash flow from all financing activities other than dividends.
- Typical cash flow source includes cash raised through the sale of stocks and bonds or bank borrowing.
Important: You will find the word "Note" with the numbered item below as you go through the actual accounting numbers in the annual report. Please read the notes as they reveal important information about certain items.
Cash Flow: Investing Activities
- This statement shows the cash used to purchase assets such as property, plant and equipment for the long-term purpose of operating the business and other investment or acquisition.
- If the business sells assets or an investment subsidiary, it will be reflected as cash from investment activity.
Note:If the expediture (purchase of property, plant and equipment) increases, you may want to investigate whether the company's revenue also increases. If expenditure increases but income does not increase, the investor should be careful
Financial ratio
- Most of us do not have the luxury of looking through financial statement all day long(or prefer to avoid looking at financial statement) after a long day at work.Hence, using the financial ratio to gauge which company to invest and trade will help to speed up the process
- A Financial ratio is simply used to evaluate whether we should invest in the company or not.
- There are many websites that show the financial ratio for different company(e.g SGX website),so we do not need to do any calculation to get the ratio(what a relief,eh?),this would also help us to save time evaluating on the company
- Hence,we are only require to understand what the different financial ratio means...
1)Liquidity,
2)Profitability
3)Debt
4)Efficiency
5)Others
1.Liquidity
Current Ratio
- A simple ratio of current asset divide by current liabilities
- Current liabilities are debt that need to clear in the short term(in a year)
- If a company has a current ratio less then 1.0, do not invest in it
- If a company has a current ratio more then 2.0, May consider investing in it
- The higher the current ratio, the better
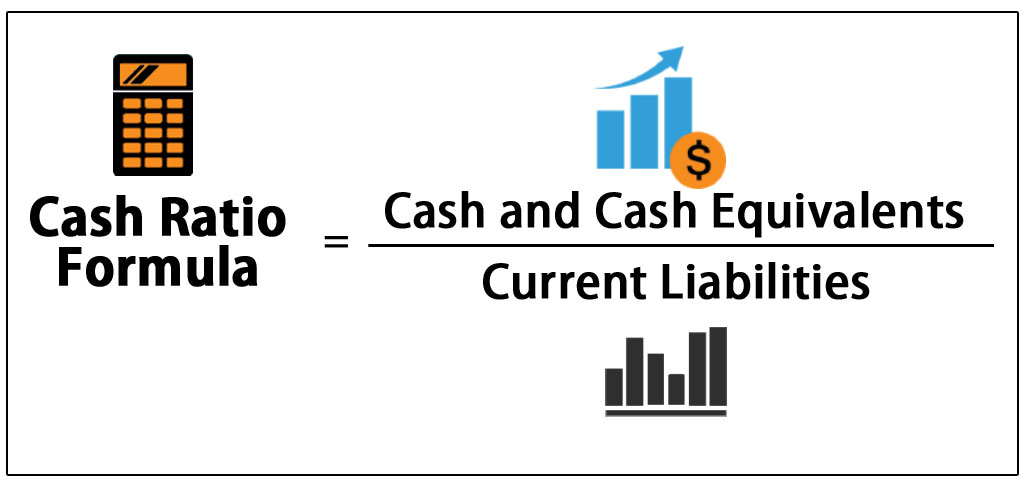
Cash Ratio

- Measures the ability of the company to cover its liabilities.
- The higher the ratio,the more cash the company has, to pay off the current liabilities
- The ideal range:More than 1
Quick ratio
- Quick ratio is used to determine if the company has enough short term assets to sell to cover its current liabilities(debt)
- The quick ratio is almost similar to current ratio except that it is assumed that the company does not sell its inventories(e.g Toyota inventory is its car) or stock, it is still able to fulfill its debt
- If the company has a quick ratio of 0.75 and below, do not invest in it
- If the company has a quick ratio of 1.25 and above, May consider investing in it
- The higher the quick ratio the better
2.Profitability
Gross Profit Margin
- The proportion of money left after deducting revenue from the cost of sold goods. It is best if the margin remains consistent or is increasing year after year.
- Ideal range: 15 % or more. Please compare with other companies in the same industry
Net Profit Margin

- The proportion of money left after deducting income from all expenses.
- It measures the ability of the company to meet all operating costs (including indirect costs).
- Low profit means that the company has no competitive advantage or the ability to increase prices.
- Ideal Range: 8 percent or more
Return on Equity
- It is one of the most important ratios to investors.
- It measures how much profit a company generates from the money of the shareholder.
- Ideal range: 15% or more
Return On Assets
- It measures how much profit the company is generating from its assets.
- It is also known as Return on Investment.
Selling,General & Administrative Expenses
- It measures the ability of the company to control its overhead.
- Ideal range: the lower the better
Will continue part 3 here!


No comments:
Post a Comment